Question 1 - How To Use Graphic And Charts
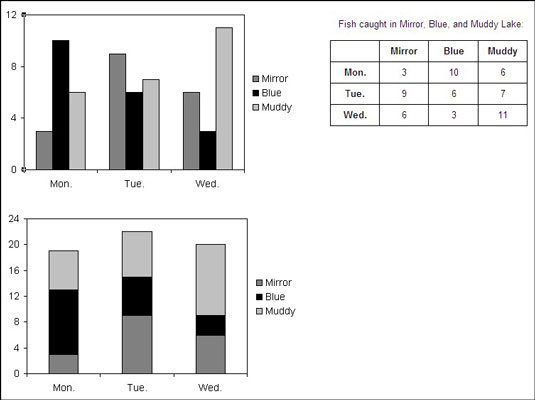
A picture looks nice on the plot area of a PowerPoint chart, especially a column chart. PowerPoint lets you use pictures on your computer to decorate your charts. Select your chart, and follow these steps to place a picture in the plot area of a PowerPoint chart:

- On the (Chart Tools) Layout tab, click the Picture button.
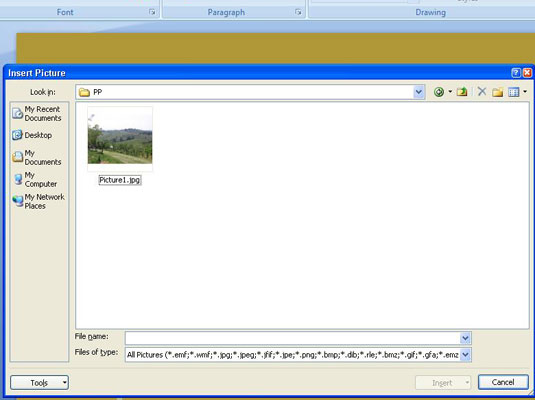
 You may have to click the Insert button first, depending on the size of your screen. You see the Insert Picture dialog box.
 - Locate the picture you need and select it.Try to select a light-colored picture that will serve as a background.

- Click the Insert button.The picture lands on your slide.
You may have to make these adjustments to the picture or chart:
- Resize the picture to make it fit over the chart: Drag a selection handle on the side or corner of a picture to resize it.
- Put the picture in the background: Select the picture, go to the (Picture Tools) Format tab, and click the Send to Back button.
- Change the picture’s transparency: Select the picture, and on the (Picture Tools) Format tab, click the Recolor button and choose a transparent option on the drop-down list.
- Change the color of a data marker: Click the data marker, select the (Chart Tools) Format tab, open the drop-down list on the Shape Fill button, and select a color.
Question 2 - How To Running Presentation
After I using powerpoint. I know how to make a easy and attractive presentation.


No comments:
Post a Comment